
If you understand risk ratings but struggle to explain what could cause an incident or limit its consequences, practise building a bow-tie around one scenario. A structured course can help you learn the method before facilitating a real assessment.
What a bow-tie diagram actually shows
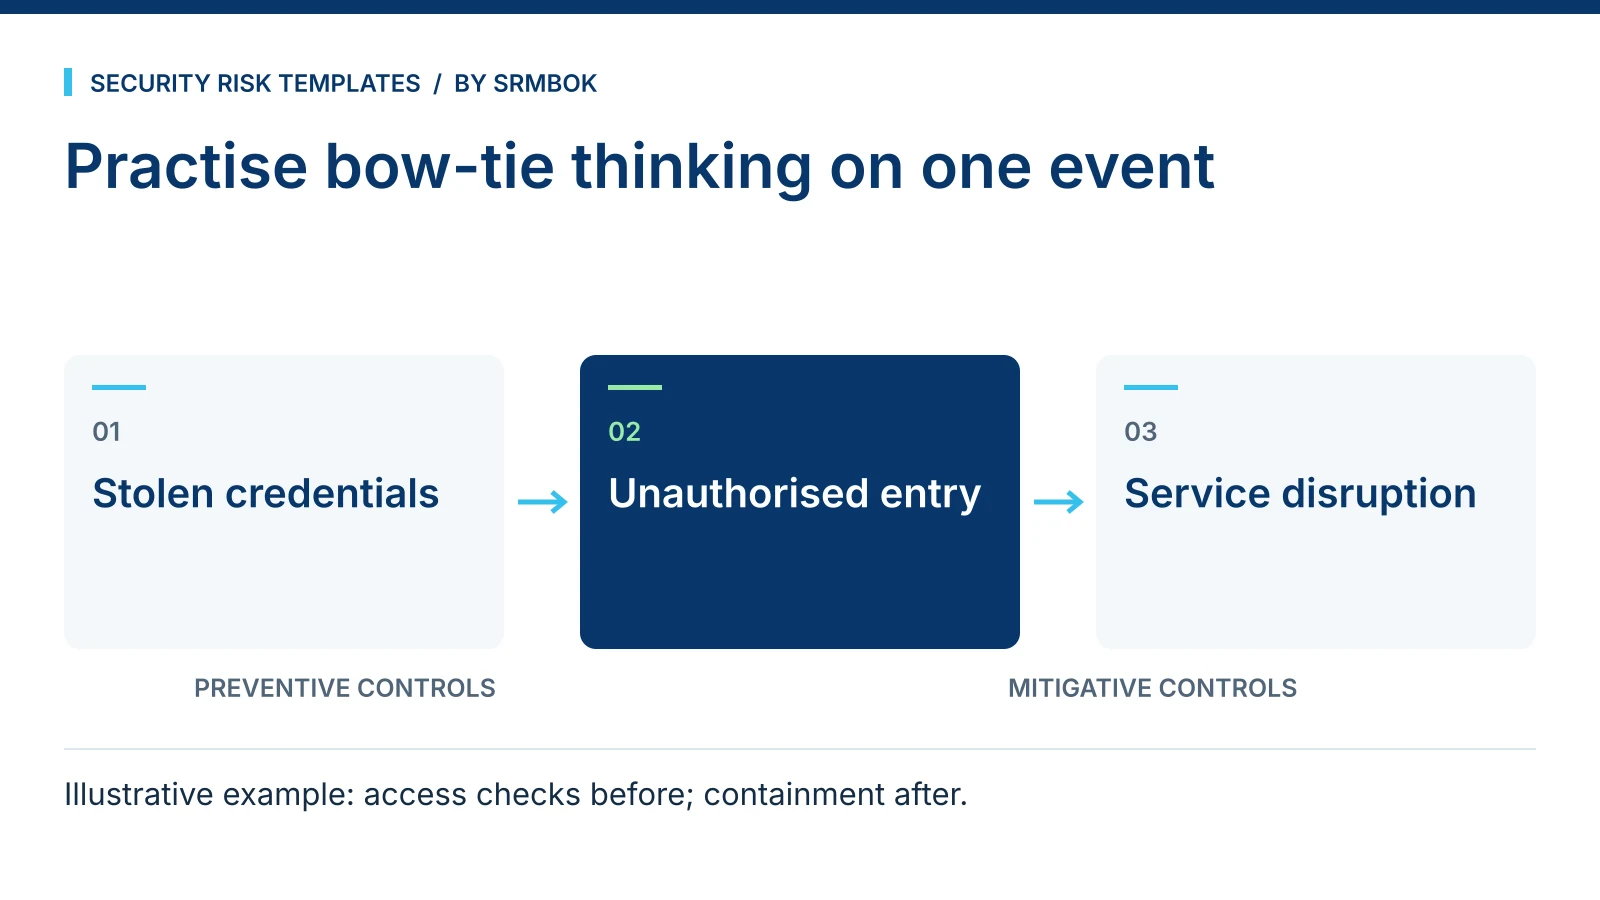
Draw a horizontal line. In the centre, place the top event — the moment control is lost, such as unauthorised access to a secure area, or a confidentiality breach of sensitive information. On the left, list the threats that could cause that top event. On the right, list the consequences that follow once it happens.
Between each threat and the top event, place the preventive controls — the barriers meant to stop that threat from causing the event at all. Between the top event and each consequence, place the mitigating controls — the barriers meant to reduce harm once the event has already happened. Drawn out, the threats fan in from the left, the consequences fan out to the right, and the whole shape resembles a bow-tie, with the top event as the knot in the middle.
The value isn't the picture. The value is what building the picture forces you to do: separate prevention from mitigation, and attach a specific control to a specific line rather than listing controls in a pile next to a risk description. A risk register can list ten controls against one risk without ever saying which one is meant to stop the threat and which one is meant to clean up afterward. A bow-tie can't be drawn that way — every control has to sit on one side of the knot or the other, which forces the distinction whether the person drawing it wants to make it or not.
Why this beats a risk register on its own
A risk register answers "what's the risk and how bad is it." A bow-tie answers "which specific control is meant to stop which specific threat, and which one actually failed." When an incident happens, that second question is the one people actually need answered. A register can correctly identify a risk yet provide little help in understanding a later failure if it never connects each control to the pathway it is meant to interrupt.
Bow-tie analysis also exposes controls that look fine on paper but are doing nothing. If a preventive control sits on the diagram with no clear owner, no test regime and no way to confirm it's actually operating, that's visible the moment you try to draw the line — which is a different experience from finding it buried in row 340 of a spreadsheet.
The elements, precisely
- Top event. The point of loss of control. Not the ultimate consequence — the moment things start going wrong.
- Threats. The credible causes that could trigger the top event. Each threat gets its own line into the knot.
- Consequences. The credible outcomes if the top event occurs, unmitigated. Each consequence gets its own line out.
- Preventive controls. Barriers between a threat and the top event. Their job is to stop the threat succeeding.
- Mitigating controls. Barriers between the top event and a consequence. Their job is to limit harm once the event has occurred.
- Escalation factors. Conditions that could defeat a control — for example, a preventive control that only works if a person follows a procedure, and that procedure is skipped under time pressure. Naming these is what separates a serious bow-tie from a diagram exercise.
Running a bow-tie session in practice
The diagram is only as good as the session that produces it. A workable sequence for building one:
- Agree the top event first, and only one per diagram. If the group can't agree on a single top event, that's a sign the risk needs splitting into two.
- List threats on the left before discussing any controls. Naming controls too early tends to shape and narrow the threat list to match whatever controls people already have in mind.
- List consequences on the right the same way, independent of the threats.
- Add preventive controls between each threat and the top event, and mitigating controls between the top event and each consequence, checking each one actually exists and isn't aspirational.
- Walk each control and ask what would have to go wrong for it to fail. That question is where escalation factors come from.
- Assign an owner to every control on the diagram before the session closes. A control with no owner doesn't survive past the workshop.
Running it in this order — threats and consequences before controls — is what stops the exercise turning into a list of existing controls with threats retrofitted to justify them.
Worked example: unauthorised access to a data centre
A fictional three-site logistics firm builds a bow-tie around the top event "unauthorised person gains physical access to the server room."
| Element | Detail |
|---|---|
| Threat 1 | Tailgating through the main entry during business hours |
| Threat 2 | Stolen or cloned access card |
| Preventive control (Threat 1) | Mantrap door with anti-tailgate sensor |
| Preventive control (Threat 2) | Card deactivation process on staff exit, tested quarterly |
| Top event | Unauthorised access to server room |
| Mitigating control | CCTV coverage with alert on after-hours motion, reviewed by security monitoring |
| Mitigating control | Server room access log reconciled weekly against approved access list |
| Consequence 1 | Theft or tampering with equipment |
| Consequence 2 | Data confidentiality breach |
| Escalation factor | Mantrap propped open during deliveries, defeating the anti-tailgate control |
The escalation factor is the line that turns this from a diagram into something useful — it names the specific way the main preventive control gets quietly disabled in practice, which is exactly the kind of thing a static control list never captures.
Common mistakes
- Too many top events on one diagram. A bow-tie works because it's specific. Trying to capture five different failure modes on one diagram produces a tangle nobody can read.
- Confusing preventive and mitigating controls. A control placed on the wrong side of the top event gives false comfort — it looks like prevention is covered when the control actually only reduces harm afterward.
- No control owner. A control on the diagram with nobody accountable for maintaining or testing it is decoration.
- Ignoring escalation factors. Skipping them is how a bow-tie ends up as reassuring rather than useful — it shows controls that would work if nothing ever went wrong with the controls themselves.
- Building it once and filing it. A bow-tie is a working document. If it isn't revisited when controls change or an incident occurs, it stops reflecting reality within months.
Take the risk bow-tie method course properly
The bow-tie method sits alongside, not instead of, the broader risk process — ISO 31000 Explained on One Page (Free Download) gives you the frame it fits inside. Once your preventive and mitigating controls are identified, they need to be tracked through to completion — Risk Treatment Schedule Template (Free) is built for exactly that handover. And if you're the one trying to get a bow-tie diagram taken seriously by colleagues who see risk management as paperwork, Explaining Risk Management to Colleagues Who Think It's Paperwork is written for that conversation.
The Risk Bow-Tie Method is a free guided online program that walks you through building your own bow-tie diagrams step by step, as a companion to the free eBook. Start the free bow-tie method course and work through it against a real risk from your own environment rather than a generic example.